
Read time: 9 min
Table of Contents
- Why You Need a Separate AI Visibility Dashboard
- The Four Metric Categories Your Dashboard Needs
- Layer 1: Search Console AI Performance Data
- Layer 2: GA4 AI Referral Traffic
- Layer 3: Brand Mention and Citation Monitoring
- Layer 4: Prompt Tracking and LLM Visibility
- Building the Dashboard in Looker Studio
- The Weekly Review Workflow
- What to Report to Clients and Stakeholders
- Tools and Cost Overview
- Bottom Line
Standard SEO dashboards were built for a world where visibility meant rankings and traffic meant clicks. That world has not disappeared, but it is no longer the complete picture.
AI Overviews, AI Mode, ChatGPT search, Perplexity, and Claude now generate brand impressions, citations, and referrals. None of them appear in standard SEO reporting tools. As a result, a brand can be cited in thousands of AI responses daily and still show zero evidence of it in a traditional ranking dashboard.
A dedicated AI visibility dashboard solves this problem. It gives you a structured view of how your brand appears across AI search surfaces, what drives those appearances, and where the gaps are. Here is the complete build guide.
1. Why You Need a Separate AI Visibility Dashboard
Adding AI metrics to an existing SEO dashboard is tempting. However, you should resist it for three reasons.
Different signals require different interpretation. Traditional SEO metrics such as rankings, organic sessions, and CTR follow well-understood patterns. AI visibility metrics follow different logic. For example, a high citation rate with low referral traffic counts as a success in AI search, not a failure. Mixing the two in one dashboard therefore leads to misinterpretation.
Different update cadences. Traditional SEO data updates daily or weekly in consistent patterns. AI visibility data, on the other hand, is more volatile. LLM responses change frequently, prompt tracking needs active monitoring, and brand mention data arrives in real time. A separate dashboard with suitable refresh rates keeps stale AI data from being confused with current SEO data.
Different stakeholder conversations. Clients who understand traditional SEO metrics may be confused when AI data sits beside familiar numbers. A dedicated dashboard creates a clear narrative: this is your traditional search performance, and that is your AI search performance. Consequently, the comparison becomes strategic rather than confusing.
2. The Four Metric Categories Your Dashboard Needs
An effective AI visibility dashboard tracks four distinct categories of data. Each one needs its own data source and monitoring approach.
Category 1: Search Console AI Performance. This category covers what Google’s own systems report about your appearance in AI-powered search features. It includes AI Overviews impressions, AI Mode appearances, and the pages that receive that visibility.
Category 2: GA4 AI Referral Traffic. These are the sessions that reach your site from AI search surfaces. You can identify them through referral source patterns in GA4 and through UTM parameters when available.
Category 3: Brand Mention and Citation Monitoring. Third-party tools track how often, and in what context, the web mentions your brand. This includes the publications and platforms that AI systems draw on when they answer questions about your category.
Category 4: Prompt Tracking and LLM Visibility. This category monitors how your brand appears when someone submits specific prompts to major LLMs. It is the most direct measurement of AI search visibility available.
You build each layer separately, and then you integrate all four into the final dashboard view.
3. Layer 1: Search Console AI Performance Data
Google Search Console’s AI Performance Reports rolled out broadly in mid-2026. They provide the most authoritative data on how your pages appear in Google’s AI-powered features.
What the reports show:
- Pages appearing in AI Overviews and AI Mode
- Impressions from AI features by page, country, device, and date
- Query data for AI feature appearances (where available)
What they do not yet show:
- Clicks from AI features (not yet released as of September 2026)
- Performance comparison between AI and non-AI appearances for the same queries
How to access and export:
Navigate to Search Console → Search Results → Filter by Search Type → AI Overviews or AI Mode. Then export the data as CSV for the date range you want to track. Typically, the last 28 days and the last 90 days work best for trend comparison.
Key metrics to pull into your dashboard:
- Total AI impressions by week (trend line)
- Top 10 pages by AI impressions (table)
- Top queries triggering AI appearances (table)
- AI impressions by country, which matters for international brands
- AI impression share trend, meaning AI impressions as a percentage of total impressions
Dashboard visualization: A line chart of AI impressions over time, with a separate line for total impressions, makes the AI share trend immediately visible. In addition, a table of top AI-impression pages ranked by volume gives content teams a clear optimization priority list.
4. Layer 2: GA4 AI Referral Traffic
GA4 captures referral sessions from AI search surfaces. However, identifying them requires knowing which referral sources to track and how to segment them correctly.
AI referral sources to monitor in GA4:
| Platform | Referral Source Pattern |
|---|---|
| ChatGPT | chatgpt.com, chat.openai.com |
| Perplexity | perplexity.ai |
| Claude | claude.ai |
| Gemini | gemini.google.com |
| Copilot | copilot.microsoft.com, bing.com (AI referrals) |
| Google AI Mode | google.com (segment by landing behavior) |
Setting up AI referral segments in GA4:
First, create a custom segment for AI referral traffic:
- Navigate to Explore → Create new exploration.
- Add a segment where Session source contains “perplexity.ai” OR “chatgpt.com” OR “claude.ai” OR “gemini.google.com” OR “copilot.microsoft.com”.
- Save it as “AI Search Referrals”.
Next, apply this segment to your standard acquisition reports. Doing so isolates AI-referred sessions from organic, direct, and other referral traffic.
Key GA4 metrics for your dashboard:
- AI referral sessions by week (trend line)
- AI referral sessions by source, broken down by platform
- Pages receiving AI referral traffic, which shows the content driving AI clicks
- AI referral engagement rate, which shows whether AI-referred users engage or bounce
- AI referral goal completions, meaning conversions from AI-referred traffic
Important caveat: GA4 AI referral data undercounts actual AI-influenced traffic. Users who see your brand in an AI response and later navigate directly to your site appear as direct traffic, not AI referral. In other words, GA4 captures only the fraction of AI-influenced visits that click through directly from the AI interface.
5. Layer 3: Brand Mention and Citation Monitoring
Brand mentions across the web feed AI systems through training data and real-time retrieval. Therefore, monitoring mention volume, sentiment, and source quality gives you a leading indicator of AI citation potential. You see it well before it shows up in prompt tracking data.
Tools for brand mention monitoring:
- Google Alerts: free and basic; it monitors indexed web content for brand name mentions
- Mention.com: offers real-time monitoring across web, social, and news sources
- Brand24: adds sentiment analysis alongside mention volume
- Semrush Brand Monitoring: integrates with your broader SEO workflow
- Ahrefs Alerts: monitors new backlinks and brand mentions simultaneously
What to track:
Mention volume trend. Is the total number of brand mentions growing, declining, or flat? A growing mention footprint builds the ambient brand presence that AI systems draw on.
Source quality distribution. Are mentions coming from authoritative, topically relevant sources? As covered in the Freshpet GEO playbook, contextual authority matters more than raw domain authority for AI citation.
Mention context. Do mentions describe your brand accurately, and in the context you want to be associated with? Mentions that mischaracterize your brand or link it to the wrong category can harm AI entity understanding.
Competitor mention comparison. Tracking your mention volume against competitors gives context for your AI citation probability. If a competitor receives 10x your mention volume from similar sources, that competitor likely appears more often in AI responses for shared queries.
Dashboard visualization: A line chart of weekly brand mentions, with a secondary line for competitor mentions, makes share-of-voice trends immediately visible. Meanwhile, a source quality breakdown, which separates mentions from high-authority and low-authority sources, shows whether mention volume translates into genuine authority signals.
6. Layer 4: Prompt Tracking and LLM Visibility
Prompt tracking is the most direct measurement of AI search visibility, and it is also the most operationally intensive. You submit specific prompts to major LLMs on a regular cadence and record how your brand appears in the responses.
Building your prompt set:
Organize prompts into four categories that cover the full customer journey:
- Awareness prompts: “What are the best [category] options?” “Who are the leading [category] providers?”
- Consideration prompts: “How does [your brand] compare to [competitor]?” “What are the pros and cons of [your brand]?”
- Decision prompts: “Is [your brand] worth it?” “What do users say about [your brand]?”
- Problem/solution prompts: “What should I use for [specific use case]?” “What [category] is best for [specific situation]?”
Start with 20-30 prompts across these categories. The Freshpet case study shows that scaling to 475 prompts is possible. Still, a focused starting set produces actionable data faster.
Running the tracking:
Submit each prompt to ChatGPT, Gemini, Claude, and Perplexity. Then record the following for each response:
- Does the response mention your brand? (Yes/No)
- In what position does the brand appear? (First, second, third, not mentioned)
- Is the description accurate?
- Which sources does the response cite alongside your brand?
- Which competitors appear in the same response?
Tools that automate prompt tracking:
- Profound: purpose-built AI visibility tracking with prompt management
- Otterly.ai: LLM monitoring with brand mention tracking
- Peec.ai: AI search visibility with competitive benchmarking
- Semrush AI Toolkit: integrated with the broader Semrush workflow
Dashboard visualization: A heat map of brand appearance rate by prompt category and by LLM platform makes gaps immediately visible. For instance, high appearance in ChatGPT but low appearance in Perplexity for the same prompts points to a source coverage gap. Perplexity draws more heavily on certain publication types, and those publications may not yet cover your brand.
7. Building the Dashboard in Looker Studio
Looker Studio (formerly Google Data Studio) is the most practical tool for a unified AI visibility dashboard. It connects natively to Search Console and GA4, accepts CSV uploads for manual data, and produces shareable, auto-refreshing reports.
Step-by-step build:
Step 1: Connect data sources
- Add Google Search Console as a data source and connect your property.
- Next, add GA4 as a data source and connect your property.
- Finally, add a Google Sheets data source for prompt tracking data and brand mention exports.
Step 2: Create the dashboard structure
Organize the dashboard into four sections that match the four metric categories:
- Page 1: Search Console AI Performance
- Page 2: GA4 AI Referral Traffic
- Page 3: Brand Mentions
- Page 4: Prompt Tracking Summary
Step 3: Build core visualizations
On each page, build three elements:
- A trend line chart showing the primary metric over the last 90 days
- A top-10 table showing the highest-performing pages, sources, or prompts
- A comparison widget showing the current period against the previous period
Step 4: Add a summary page
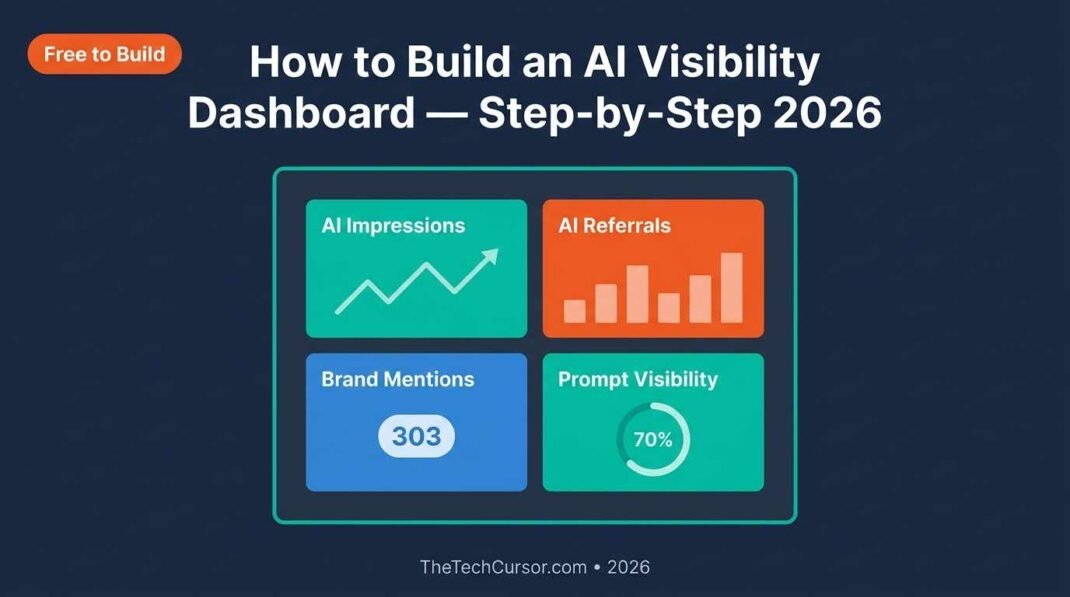
Create a single-page executive summary that shows the four key metrics side by side: total AI impressions, AI referral sessions, brand mention volume, and average prompt appearance rate. You will share this page with clients and stakeholders.
Step 5: Set refresh schedules
- Search Console and GA4 connections refresh automatically.
- Google Sheets data needs a manual update whenever you add new prompt tracking or brand mention data.
- To stay consistent, set a calendar reminder for weekly data updates.
8. The Weekly Review Workflow
A dashboard is only useful if it drives action. For that reason, a weekly review workflow ensures the data turns into decisions.
Monday: Data update. Update the Google Sheets with the previous week’s prompt tracking results and brand mention export. Meanwhile, the Looker Studio dashboard refreshes automatically from Search Console and GA4.
Tuesday: Trend review. Review each of the four metric trend lines. A spike or drop of more than 15% from the previous week warrants investigation, so flag any such change.
Wednesday: Gap identification. Review the prompt tracking heat map for gaps, such as prompts where your brand does not appear or appears below competitors. Then identify whether the gap is a content problem (no page addresses the topic) or a citation problem (content exists, but nobody cites it).
Thursday: Action planning. Decide on the right response for each gap. Content gaps go onto the editorial calendar. Citation gaps go into the digital PR or invisible PR outreach plan. Technical gaps, such as JavaScript rendering issues and crawlability problems, join the technical SEO queue.
Friday: Reporting. Update the client or stakeholder report with the week’s highlights: what improved, what declined, and which actions you plan in response.
9. What to Report to Clients and Stakeholders
AI visibility reporting needs a different narrative than traditional SEO reporting. The metrics are less familiar, and the connection to business outcomes is less direct.
Lead with the business question, not the metric. Instead of “AI impressions increased 23% this week,” say “Your brand now appears in AI responses for 47 of the 80 prompts we track, up from 31 last month. In practice, when potential customers ask AI systems about [category], your brand is part of the answer more than half the time.”
Show the competitive context. AI visibility metrics become more meaningful when you compare them with competitors. For example, “We appear in 47 of 80 prompts, while Competitor A appears in 62” is more actionable than the absolute number alone.
Connect to business outcomes where possible. AI referral traffic in GA4 shows direct business impact, even though it undercounts. Reporting these results alongside traditional organic metrics gives stakeholders a complete picture of search performance across both traditional and AI surfaces.
Be honest about measurement limitations. AI visibility measurement is genuinely imperfect. GA4 undercounts, prompt tracking is a sample rather than a census, and Search Console click data from AI features is not yet available. Acknowledging these limitations builds credibility rather than eroding it.
10. Tools and Cost Overview
Building an AI visibility dashboard costs anywhere from nothing to several hundred dollars per month, depending on the prompt tracking and brand monitoring tools you choose.
| Tool | Purpose | Cost |
|---|---|---|
| Google Search Console | AI Performance data | Free |
| GA4 | AI referral traffic | Free |
| Looker Studio | Dashboard building | Free |
| Google Alerts | Basic brand monitoring | Free |
| Google Sheets | Prompt tracking data management | Free |
| Screaming Frog | Technical crawl for structure audit | £259/year |
| Mention.com | Real-time brand monitoring | From $41/month |
| Profound | Automated prompt tracking | From $99/month |
| Otterly.ai | LLM brand monitoring | From $79/month |
| Semrush AI Toolkit | Integrated AI + SEO monitoring | Included in Semrush Pro+ |
Minimum viable dashboard (free tier): Search Console + GA4 + Looker Studio + Google Alerts + Google Sheets for manual prompt tracking gives you a functional AI visibility dashboard at zero additional cost.
Professional dashboard: Add Mention.com or Brand24 for automated brand monitoring. Then add Profound or Otterly.ai for automated prompt tracking. Together, they bring a substantially more comprehensive setup for approximately $150-200/month.
11. Bottom Line
An AI visibility dashboard is no longer optional for brands that care about their search presence. AI search sends billions of impressions, yet standard SEO reporting hides most of them.
The four-layer approach captures the full picture of AI search visibility in a structured, actionable format. It combines Search Console AI data, GA4 AI referrals, brand mention monitoring, and prompt tracking.
Start with the free tier: Search Console, GA4, Looker Studio, and manual prompt tracking in Google Sheets. Then add automated tools as your program matures and the value of more comprehensive data becomes clear.
Brands that build this measurement infrastructure now will gain months of baseline data. They will also be able to detect and respond to AI visibility changes before competitors catch on, which usually happens once AI visibility comes up in every client meeting.
Build the dashboard this week. The data will tell you where to focus next.
Pingback: Google Admits Search Console's AI Reporting Is Inadequate - The Tech Cursor
Pingback: Google Gemini AI Adds UTM Parameters: What It Means - The Tech Cursor
Pingback: Anthropic's Power Prompts: A Marketer's Guide to Fable 5.1 - The Tech Cursor
Pingback: Before You Hire an SEO Auditor: What You're Actually Paying For in 2026 - The Tech Cursor
Pingback: Google's Official GBP Playbook 2026 — The Stats and Tips Every Local Business Needs to Know - The Tech Cursor
Pingback: Cloudflare: Disallow AI Training Without Blocking Google - The Tech Cursor
Pingback: WeatherNext 3: Google Search Is Becoming a Task Engine - The Tech Cursor
Pingback: SEO Content Roadmap for the AI Search Era: A 7-Step Guide - The Tech Cursor
Pingback: Why Track AI Prompts in Every Language You Operate In - The Tech Cursor